Scouting and stats
Most FTC scouting effort goes into rebuilding numbers that the match results already contain. Robolyst computes them for every event in the archive, yours and everyone else’s, so the time you spend scouting goes into the judgement calls a spreadsheet can’t make.
Free for every team · run by a 501(c)(3)
Every event in the archive gets this table, computed from the published results.
Ranked against all 36 teams at the event. Strength is green above the 74.0 field average and red below it. Luck says how much of a record was the draw.
On screen
The page itself, captured out of the live demo, which anyone can open, without an account.
Open it yourself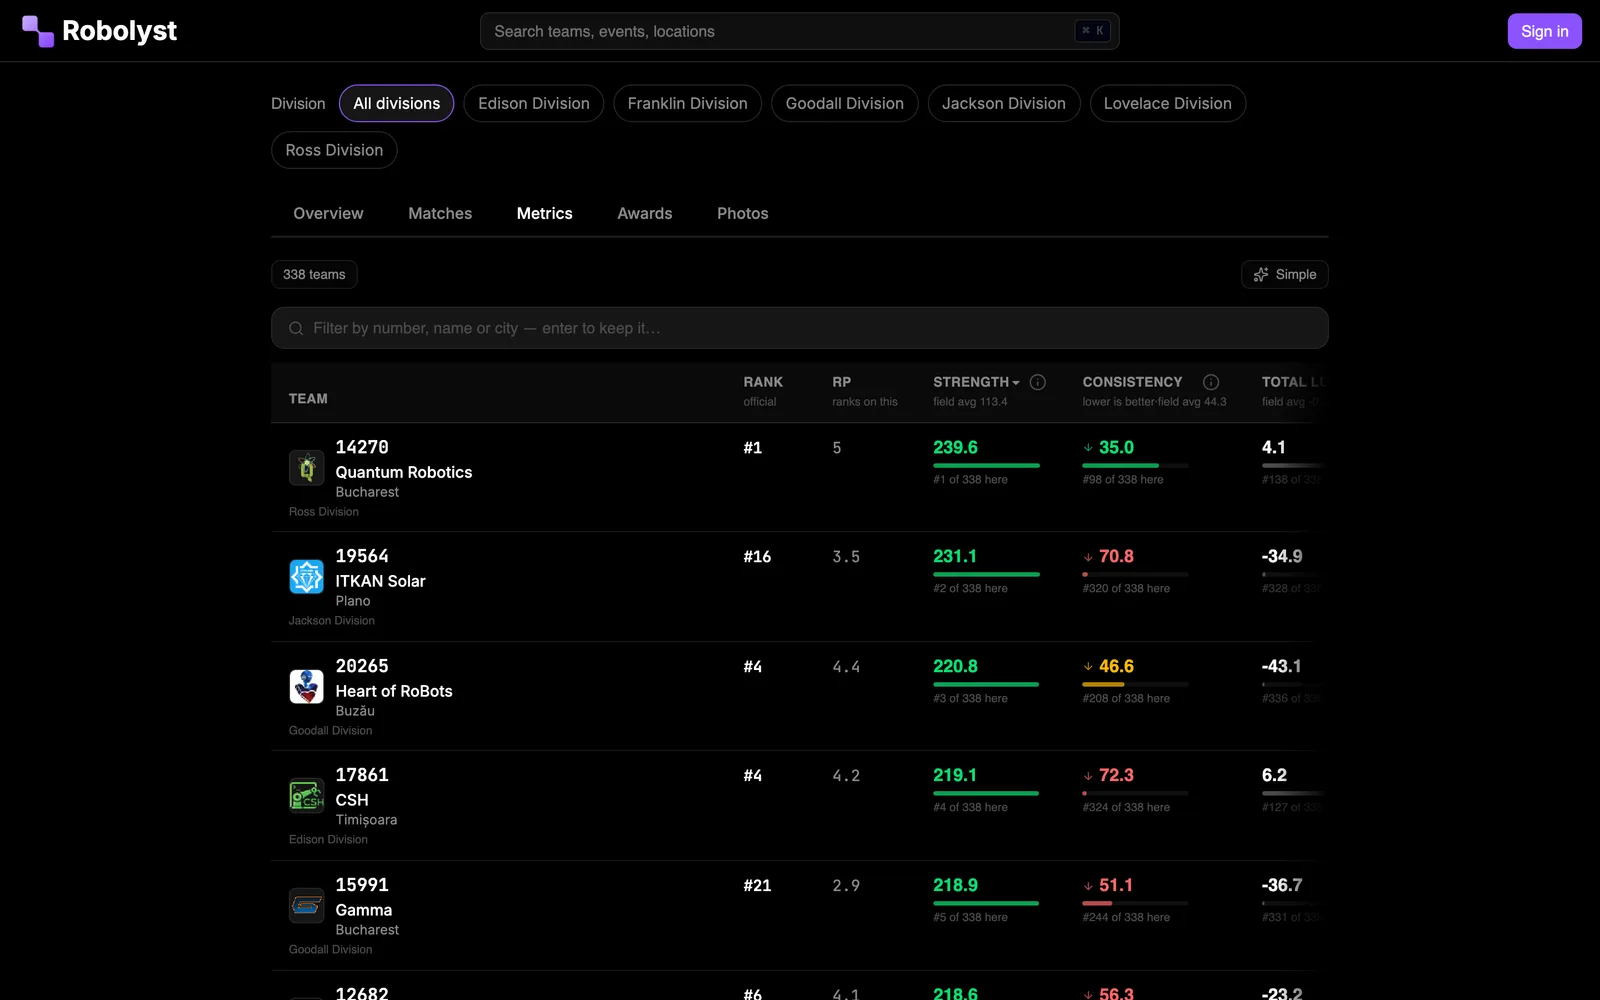
A picklist you can work on selection day
The board opens ranked by fit against your own robot, then it is yours to drag. Everyone on your team sees each move as it happens, teams come off as alliances form, and it prints to paper for the person actually standing at the table.
- Live for the whole team at once: the row someone else is dragging is locked, not fought over
- Do-not-pick marks, alliance grid, and a printable sheet with your notes on it
Every metric, every event
Each event gets a full metrics table the moment its qualification results land. Nothing to import, nothing to maintain between competitions.
- OPRc: constrained, penalty-free offensive contribution, broken down by scoring section
- OPR, Clean OPR and CCWM for the seasons before score details existed
- Strength and schedule-adjusted OPR, which correct for who a team actually faced
- Consistency and reliability, so a steady 60 is distinguishable from an average of 20 and 100
- Partner and schedule luck, which say how much of a record was the draw
Built for alliance selection
The table sorts on any column, splits OPRc by phase of the match, and flags the teams whose record overstates or understates them. Two teams with the same OPRc are not the same pick if one earns it in autonomous. The split shows that before you commit.
A watchlist that follows a team all season
Star the teams you keep running into and they collect notes wherever you meet them. Notes and tags are your team’s alone: nobody else at the event sees what you wrote, at that event or any of the ones after it.
- Your own tags, defined once and used across every event
- Season OPR shown next to what you saw with your own eyes, so a strong impression can be checked
- A robot profile you fill in once, which is what the picklist ranks other teams against
Your season, tracked without effort
Your team’s page fills in as you compete: record, awards, metrics event by event, and an OPR trend across the season. Nobody has to remember to update it.
Open methodology
Every number is documented with the formula behind it and the mistake people make reading it. If a metric would mislead you, the page that defines it says so.
Questions teams ask
- Do we have to enter our own scouting data?
- No. Everything is computed from published FIRST match results, so an event is covered the moment its results are posted, including events you did not attend.
- Does it work for older seasons?
- Yes. OPRc needs the per-section score details FIRST publishes for recent seasons; older events fall back to OPR, and rankings use whichever is available.
- Can we still do our own pit scouting?
- That is the other half of it. Computed metrics describe what happened on the field, not build quality, driver practice or how a team handles a bad match. Pit sheets and your team’s private notes carry that, and both sit on the same report.
- We run an event. What does this take from us?
- Printing one page per pit. A coordinator link mints a QR sheet for every registered team, and the report fills itself in as teams scan them. Robolyst never asks the event for a roster, a spreadsheet or a login.
Scouting and stats is one part of the portal.
The roster, the build schedule, your documentation, the money and your public site run on the same free account. Setting it up takes an afternoon.